Metrics Server in Kubernetes 🚀
1. What is Metrics Server?
🔹 Metrics Server is a lightweight, scalable resource monitoring solution for Kubernetes.
🔹 It collects real-time CPU and memory usage from Kubelets and exposes it via the Kubernetes API.
🔹 Used for Horizontal Pod Autoscaler (HPA), Vertical Pod Autoscaler (VPA), and Kubernetes Dashboards.
2. Key Features
✅ Lightweight & Efficient – Minimal resource usage
✅ Real-time Metrics – CPU & memory usage for Pods and Nodes
✅ Supports Autoscaling – Required for HPA & VPA
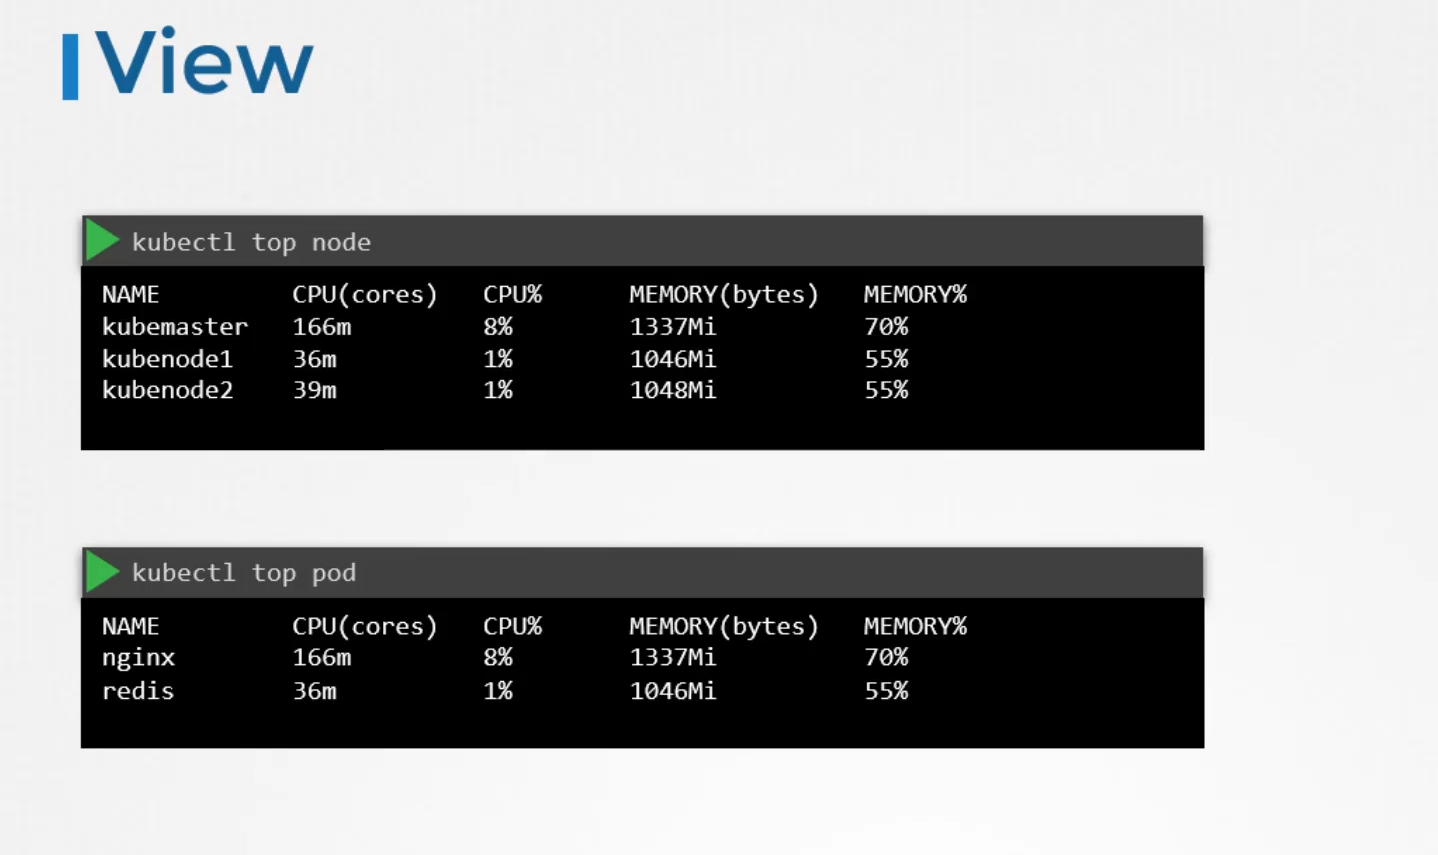
✅ Works with kubectl – Enables kubectl top nodes/pods
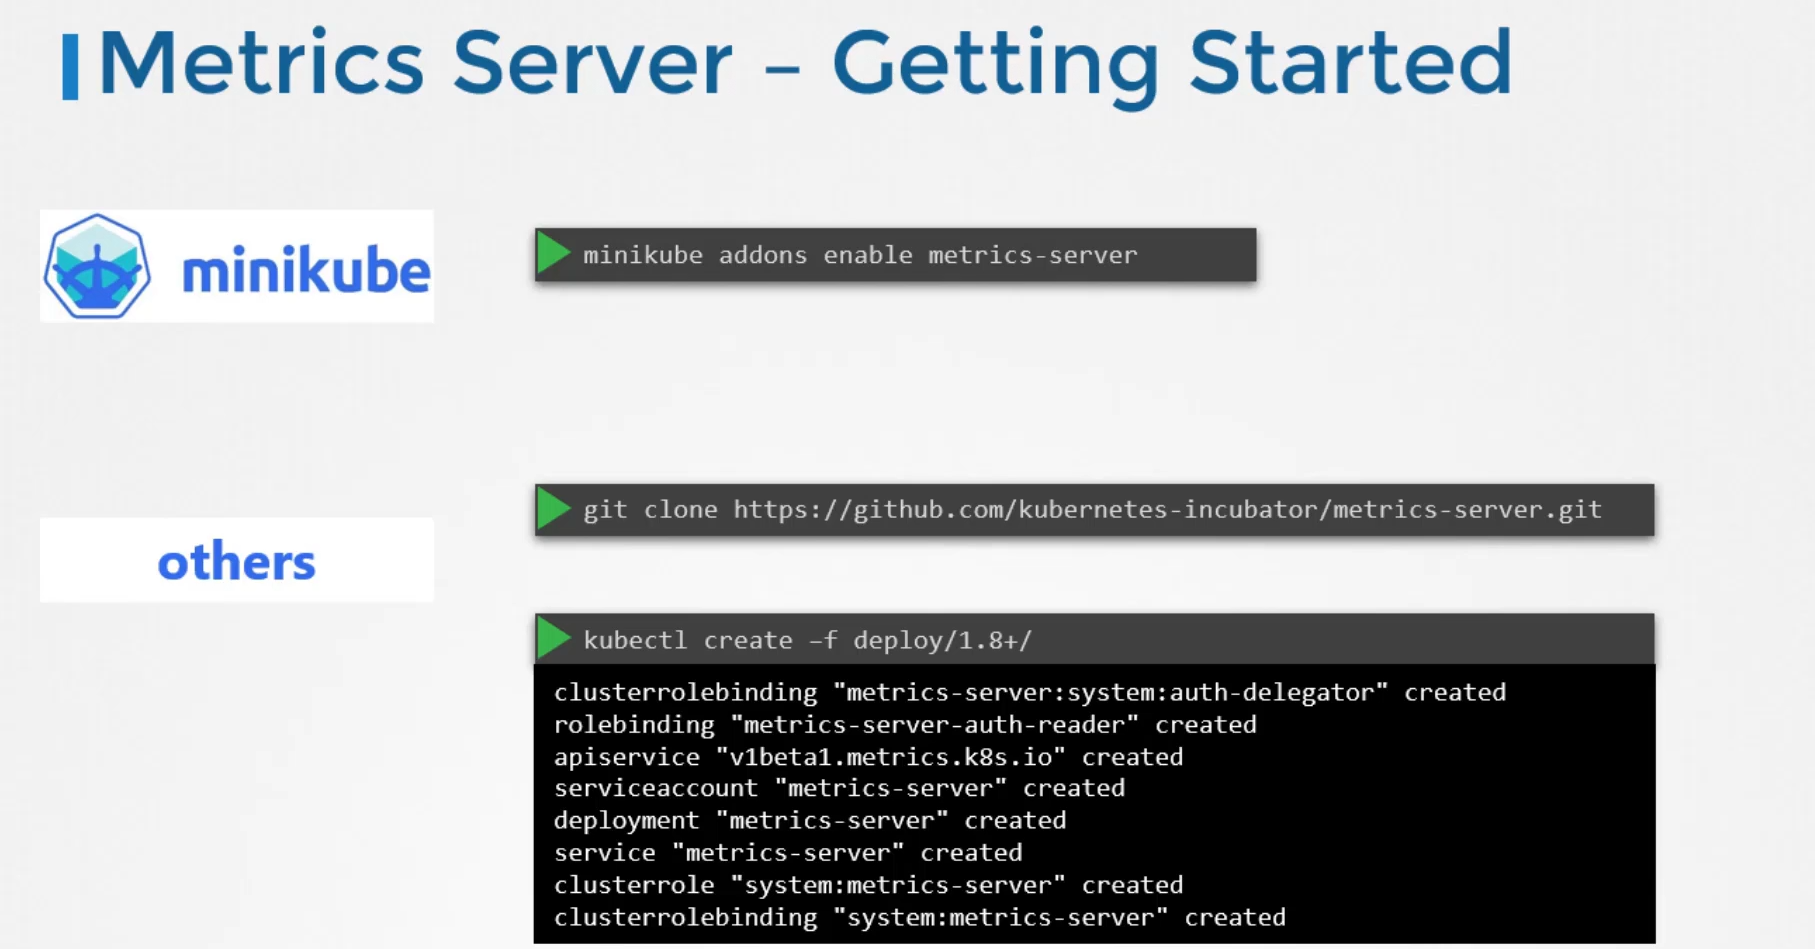
3. Install Metrics Server in Kubernetes
🔹 Install via Helm (Recommended)
helm repo add metrics-server https://kubernetes-sigs.github.io/metrics-server/
helm repo update
helm install metrics-server metrics-server/metrics-server
🔹 Install Manually Using YAML
kubectl apply -f https://github.com/kubernetes-sigs/metrics-server/releases/latest/download/components.yaml4. Verify Installation
Check Metrics Server Status
kubectl get deployment -n kube-system metrics-serverCheck Node Resource Usage
kubectl top nodesCheck Pod Resource Usage
kubectl top pods --all-namespaces5. Common Issues & Fixes
🚨 Unable to fetch metrics Error
🔹 The Metrics Server cannot connect to Kubelets due to missing flags.
✅ Fix: Edit the deployment and add --kubelet-insecure-tls
kubectl edit deployment metrics-server -n kube-system🔹 Add this under args:
- --kubelet-insecure-tlsThen restart Metrics Server:
kubectl rollout restart deployment metrics-server -n kube-system6. Use Cases
✅ Enables kubectl top nodes/pods
✅ Required for Horizontal Pod Autoscaler (HPA)
✅ Required for Vertical Pod Autoscaler (VPA)
✅ Helps with cluster monitoring & debugging
7. Best Practices
✅ Always deploy Metrics Server for monitoring & autoscaling
✅ Use Prometheus if you need long-term metrics storage
✅ Ensure kubelet API is accessible for Metrics Server
✅ Enable TLS verification for security
Let me know if you need more details! 🚀
Monitoring and Logging in Kubernetes 🚀
1. Why Monitor & Log Kubernetes Clusters?
🔹 Detect performance bottlenecks 🚀
🔹 Troubleshoot issues faster 🛠️
🔹 Optimize resource utilization 📊
🔹 Improve security 🔐
2. Monitoring Kubernetes
🔹 Key Metrics to Monitor
✅ Cluster Health → Node status, CPU, Memory usage
✅ Pod & Container Health → Restart count, CrashLoopBackOff
✅ Networking → Request latency, dropped packets
✅ Storage → Disk usage, IOPS
✅ API Server → Request rates, error rates
🔹 Tools for Kubernetes Monitoring
| Tool | Purpose |
|---|---|
| Prometheus | Open-source monitoring, metric collection |
| Grafana | Visualization & dashboards for Prometheus |
| Metrics Server | Lightweight resource metrics API |
| Kube-State-Metrics | Exposes cluster state metrics |
| Thanos/Mimir | Scalable Prometheus alternative |
| Datadog, New Relic, Dynatrace | Managed monitoring services |
🔹 Deploying Prometheus & Grafana (Best Practice)
1️⃣ Install Prometheus Stack using Helm
helm repo add prometheus-community https://prometheus-community.github.io/helm-charts
helm repo update
helm install prom-stack prometheus-community/kube-prometheus-stack
2️⃣ Access Prometheus Dashboard
kubectl port-forward svc/prom-stack-prometheus 9090📌 Open: http://localhost:9090
3️⃣ Install Grafana
Grafana is included in the Helm chart. To access:
kubectl port-forward svc/prom-stack-grafana 3000📌 Open: http://localhost:3000
📌 Default login: admin / prom-operator
3. Logging in Kubernetes
🔹 Types of Logs
✅ Pod Logs → Application logs inside containers
✅ Node Logs → Logs from Kubelet & system services
✅ Cluster Logs → API Server, Controller logs
🔹 Tools for Kubernetes Logging
| Tool | Purpose |
|---|---|
| Fluentd / Fluent Bit | Collect & process logs |
| Elasticsearch | Log storage & search |
| Loki | Lightweight log aggregation |
| Kibana | Visualization for Elasticsearch |
| SigNoz | Open-source alternative to Datadog |
| AWS CloudWatch, GCP Stackdriver | Managed log storage |
🔹 Setting Up Fluent Bit + Loki + Grafana (Best Practice)
1️⃣ Install Loki via Helm
helm repo add grafana https://grafana.github.io/helm-charts
helm repo update
helm install loki grafana/loki-stack
2️⃣ Configure Fluent Bit
[OUTPUT]
    Name loki
    Match *
    Host loki
    Port 3100
    Labels job=fluentbit
Apply the Fluent Bit config and restart Fluent Bit.
3️⃣ Access Logs in Grafana
- Add Loki as a Data Source
- Create a Log Dashboard
4. Best Practices for Monitoring & Logging
✅ Use Prometheus & Grafana for metrics 📊
✅ Use Loki or Elasticsearch for logs 📜
✅ Set up alerts in Prometheus (e.g., Pod crash alert) ⚠️
✅ Use Fluent Bit for lightweight log collection
✅ Enable Kubernetes Audit Logs for security monitoring
Let me know if you need step-by-step setup! 🚀